Use our powerful Dashboards to visualize the metrics that matter most to your business
Use our powerful Dashboards to visualize the metrics that matter most to your business
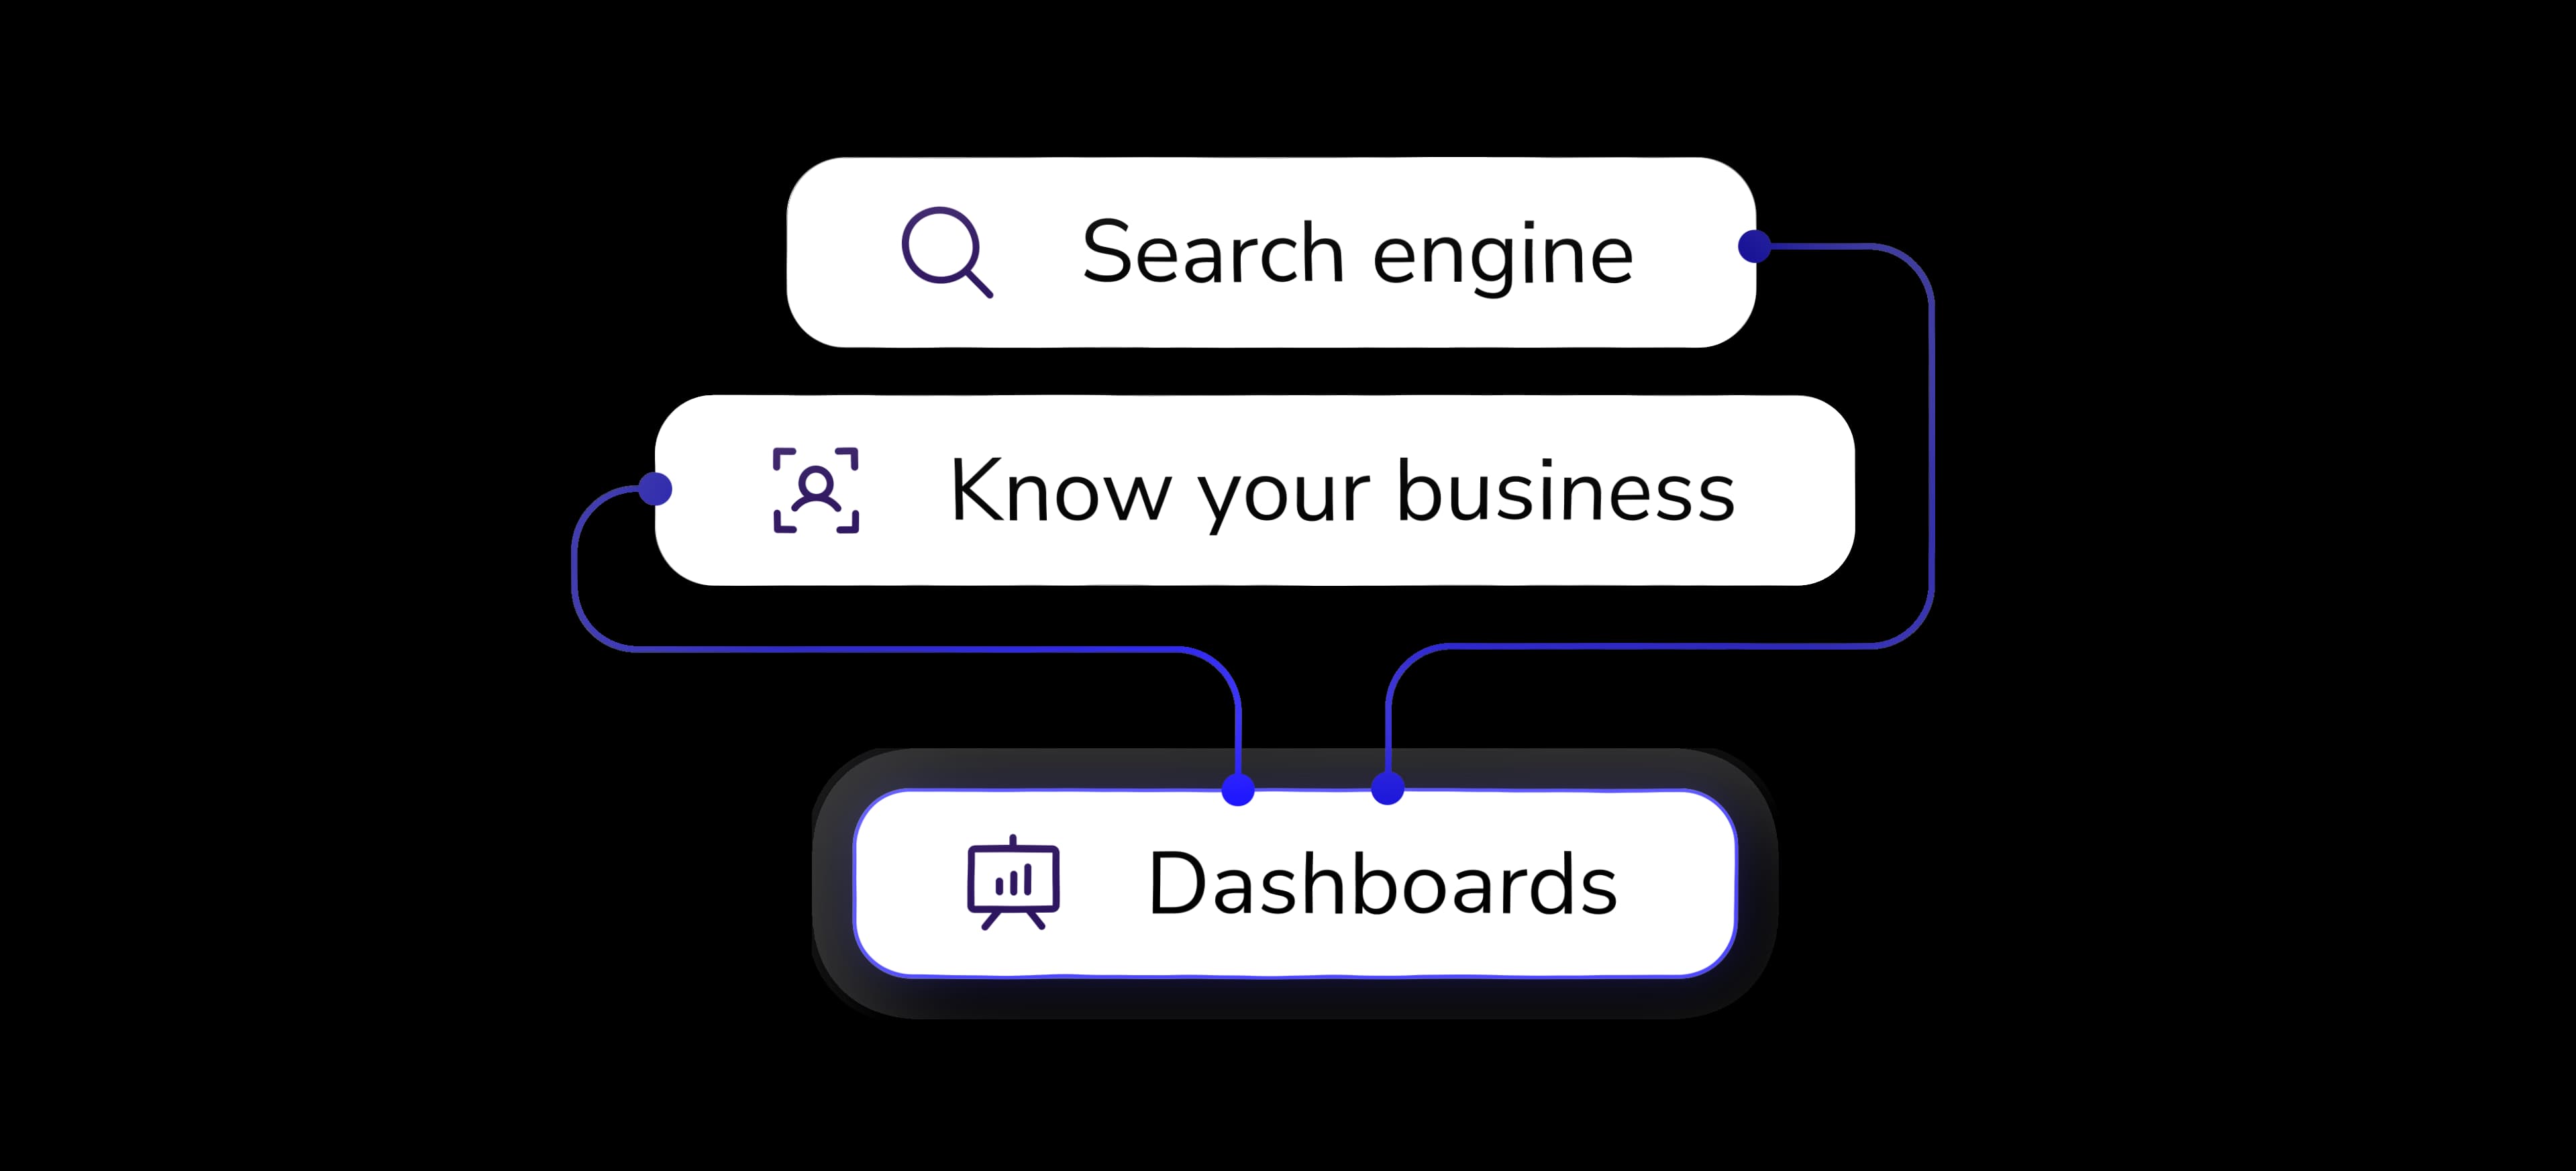
Built to work seamlessly with both Know Your Business (private crawl) and our Search Engine (public crawl), Dashboards turn structured data from 350M+ active domains and over 200 fields into clean, interactive overviews. Fully customizable, they let you choose exactly the metrics you need, monitor trends, compare markets, and surface insights tailored to your business.
Fully customizable
Design dashboards exactly the way you want. Choose from all available fields and build overviews that match your workflow, focus, and business needs.
Scalable views
Add up to 10 data points per page and create a maximum of 10 pages. Enough flexibility to track both broad trends and detailed metrics side by side.
Client access
Share dashboards directly with your customers. Combine them with insights from Know Your Business to provide secure, transparent reporting that builds trust and strengthens relationships.
Trusted by the most data-driven enterprises
Book a Free Demo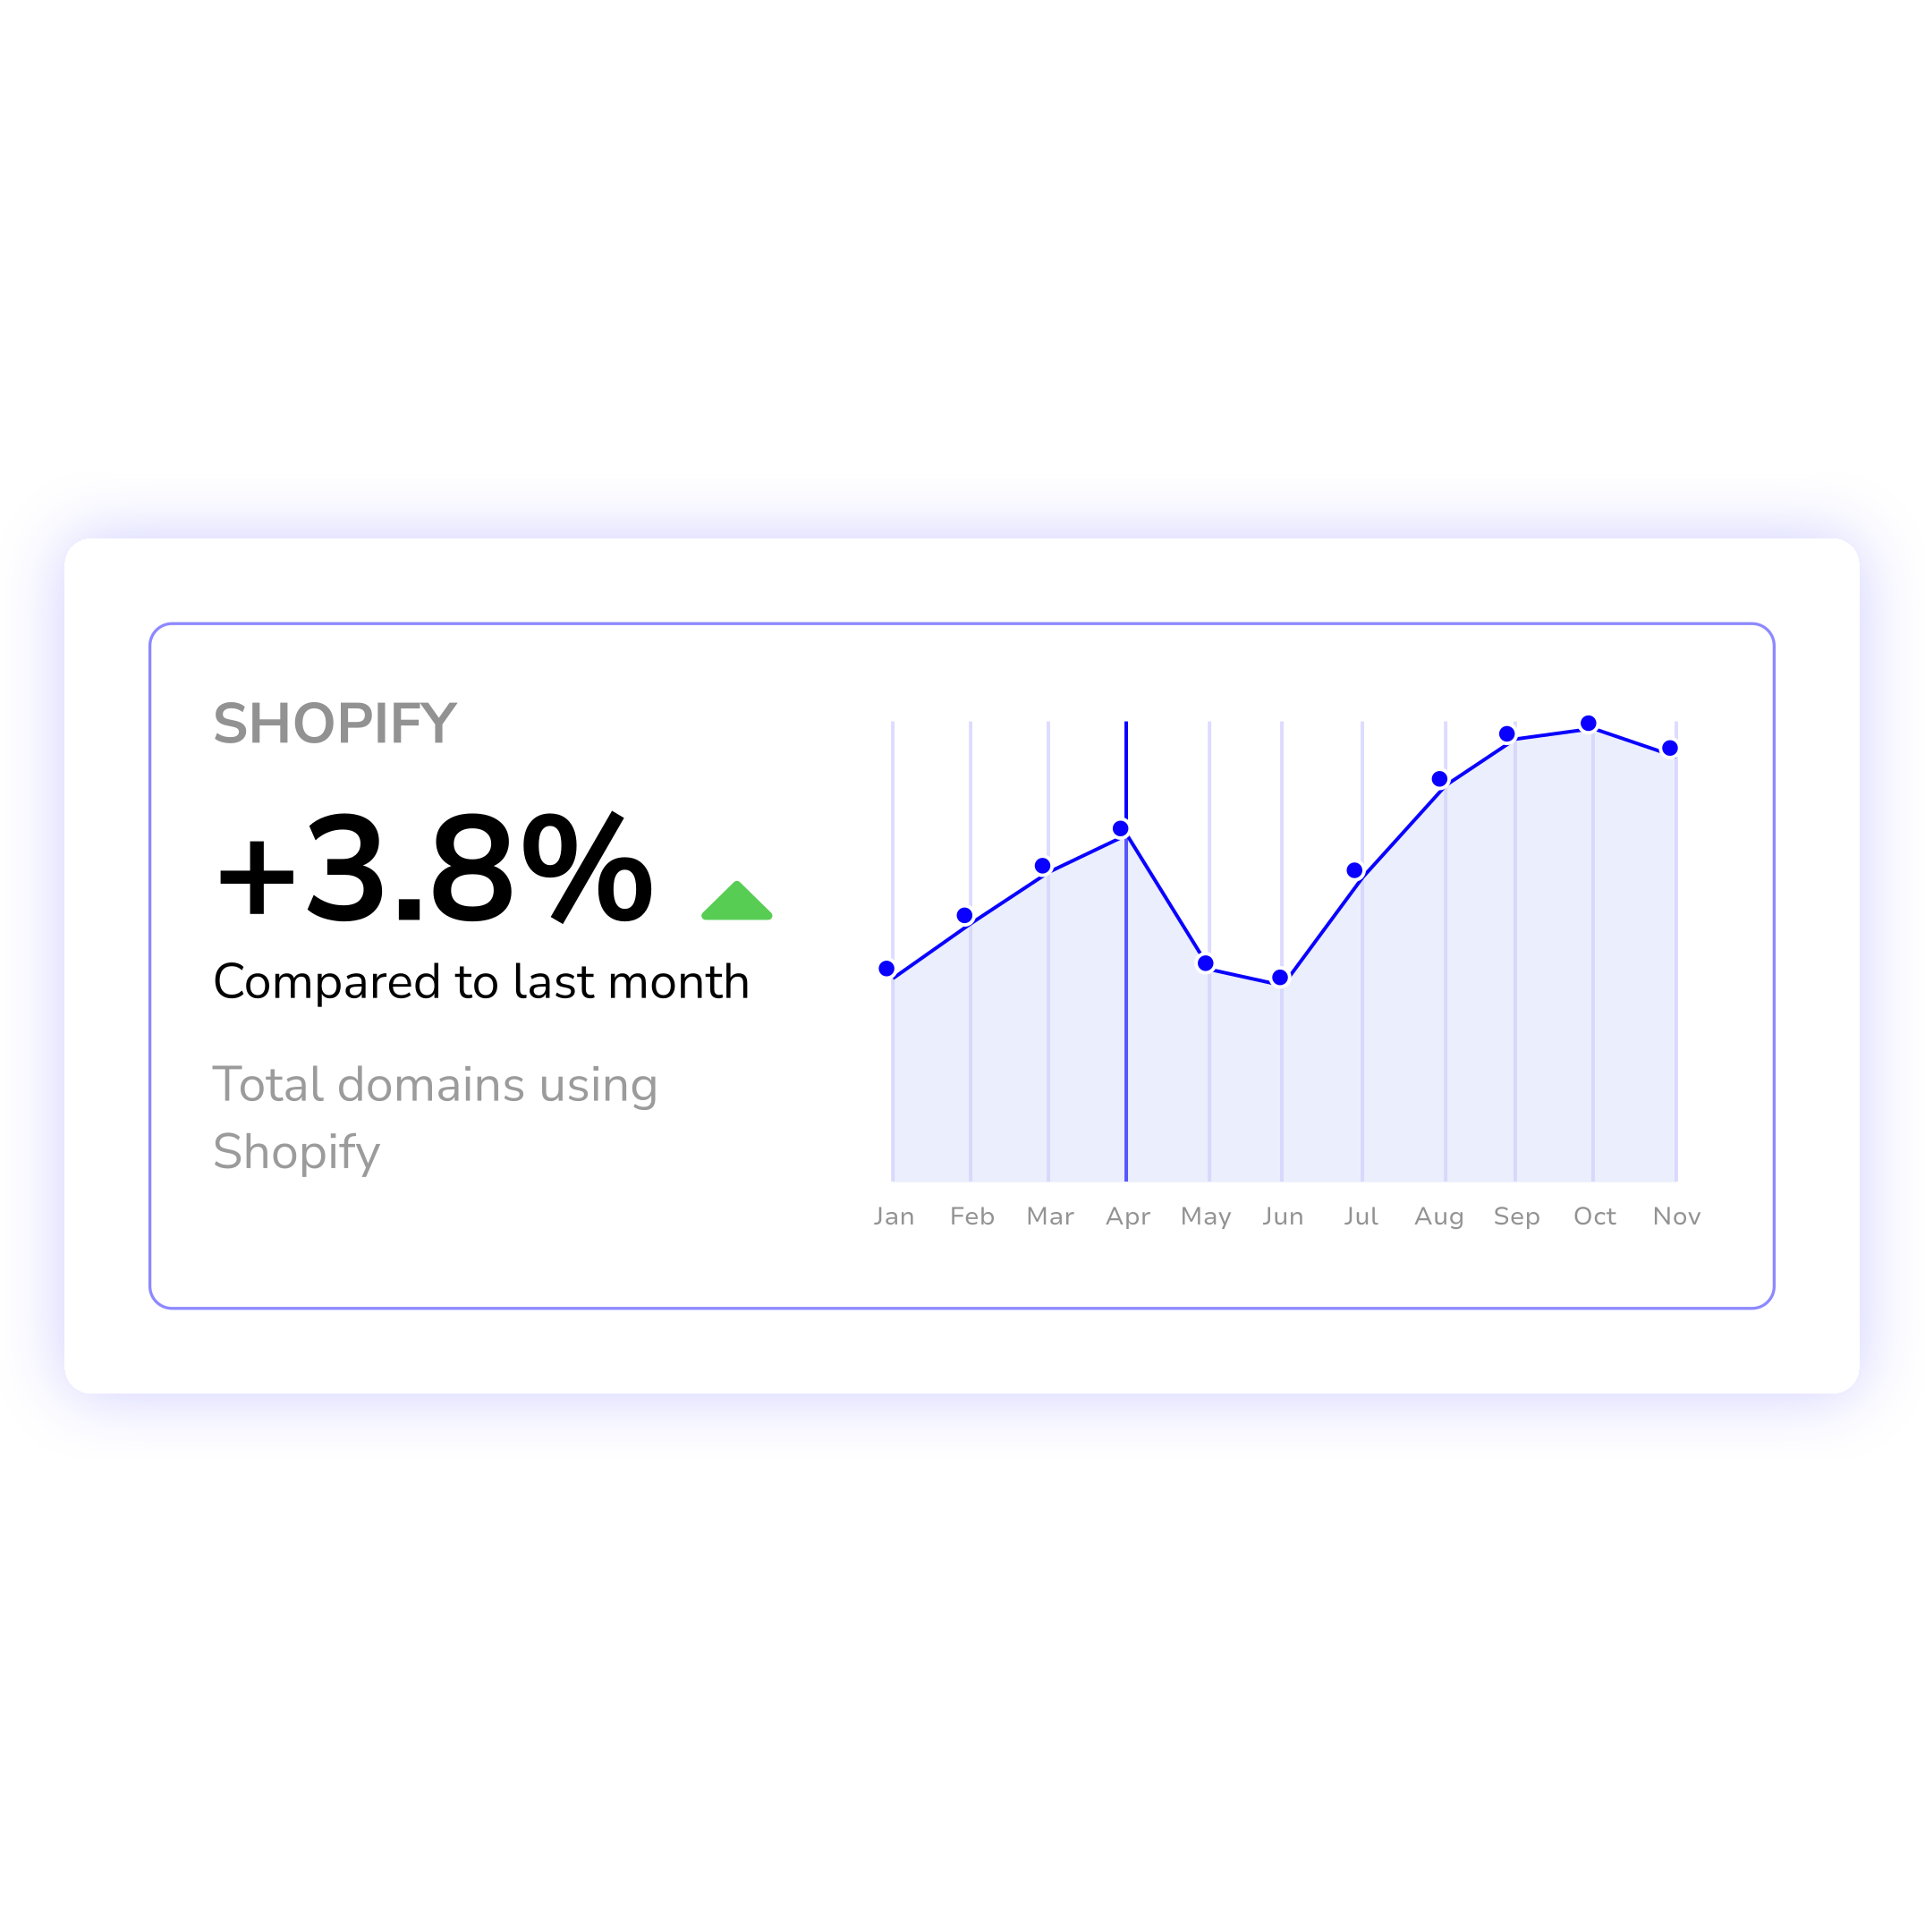
Make data actionable
Web data becomes truly powerful when you can see it. Dashboards turn complex signals into clear visuals, highlighting what matters most. This makes insights easier to share across teams and actionable throughout your organization and beyond.
Use cases:
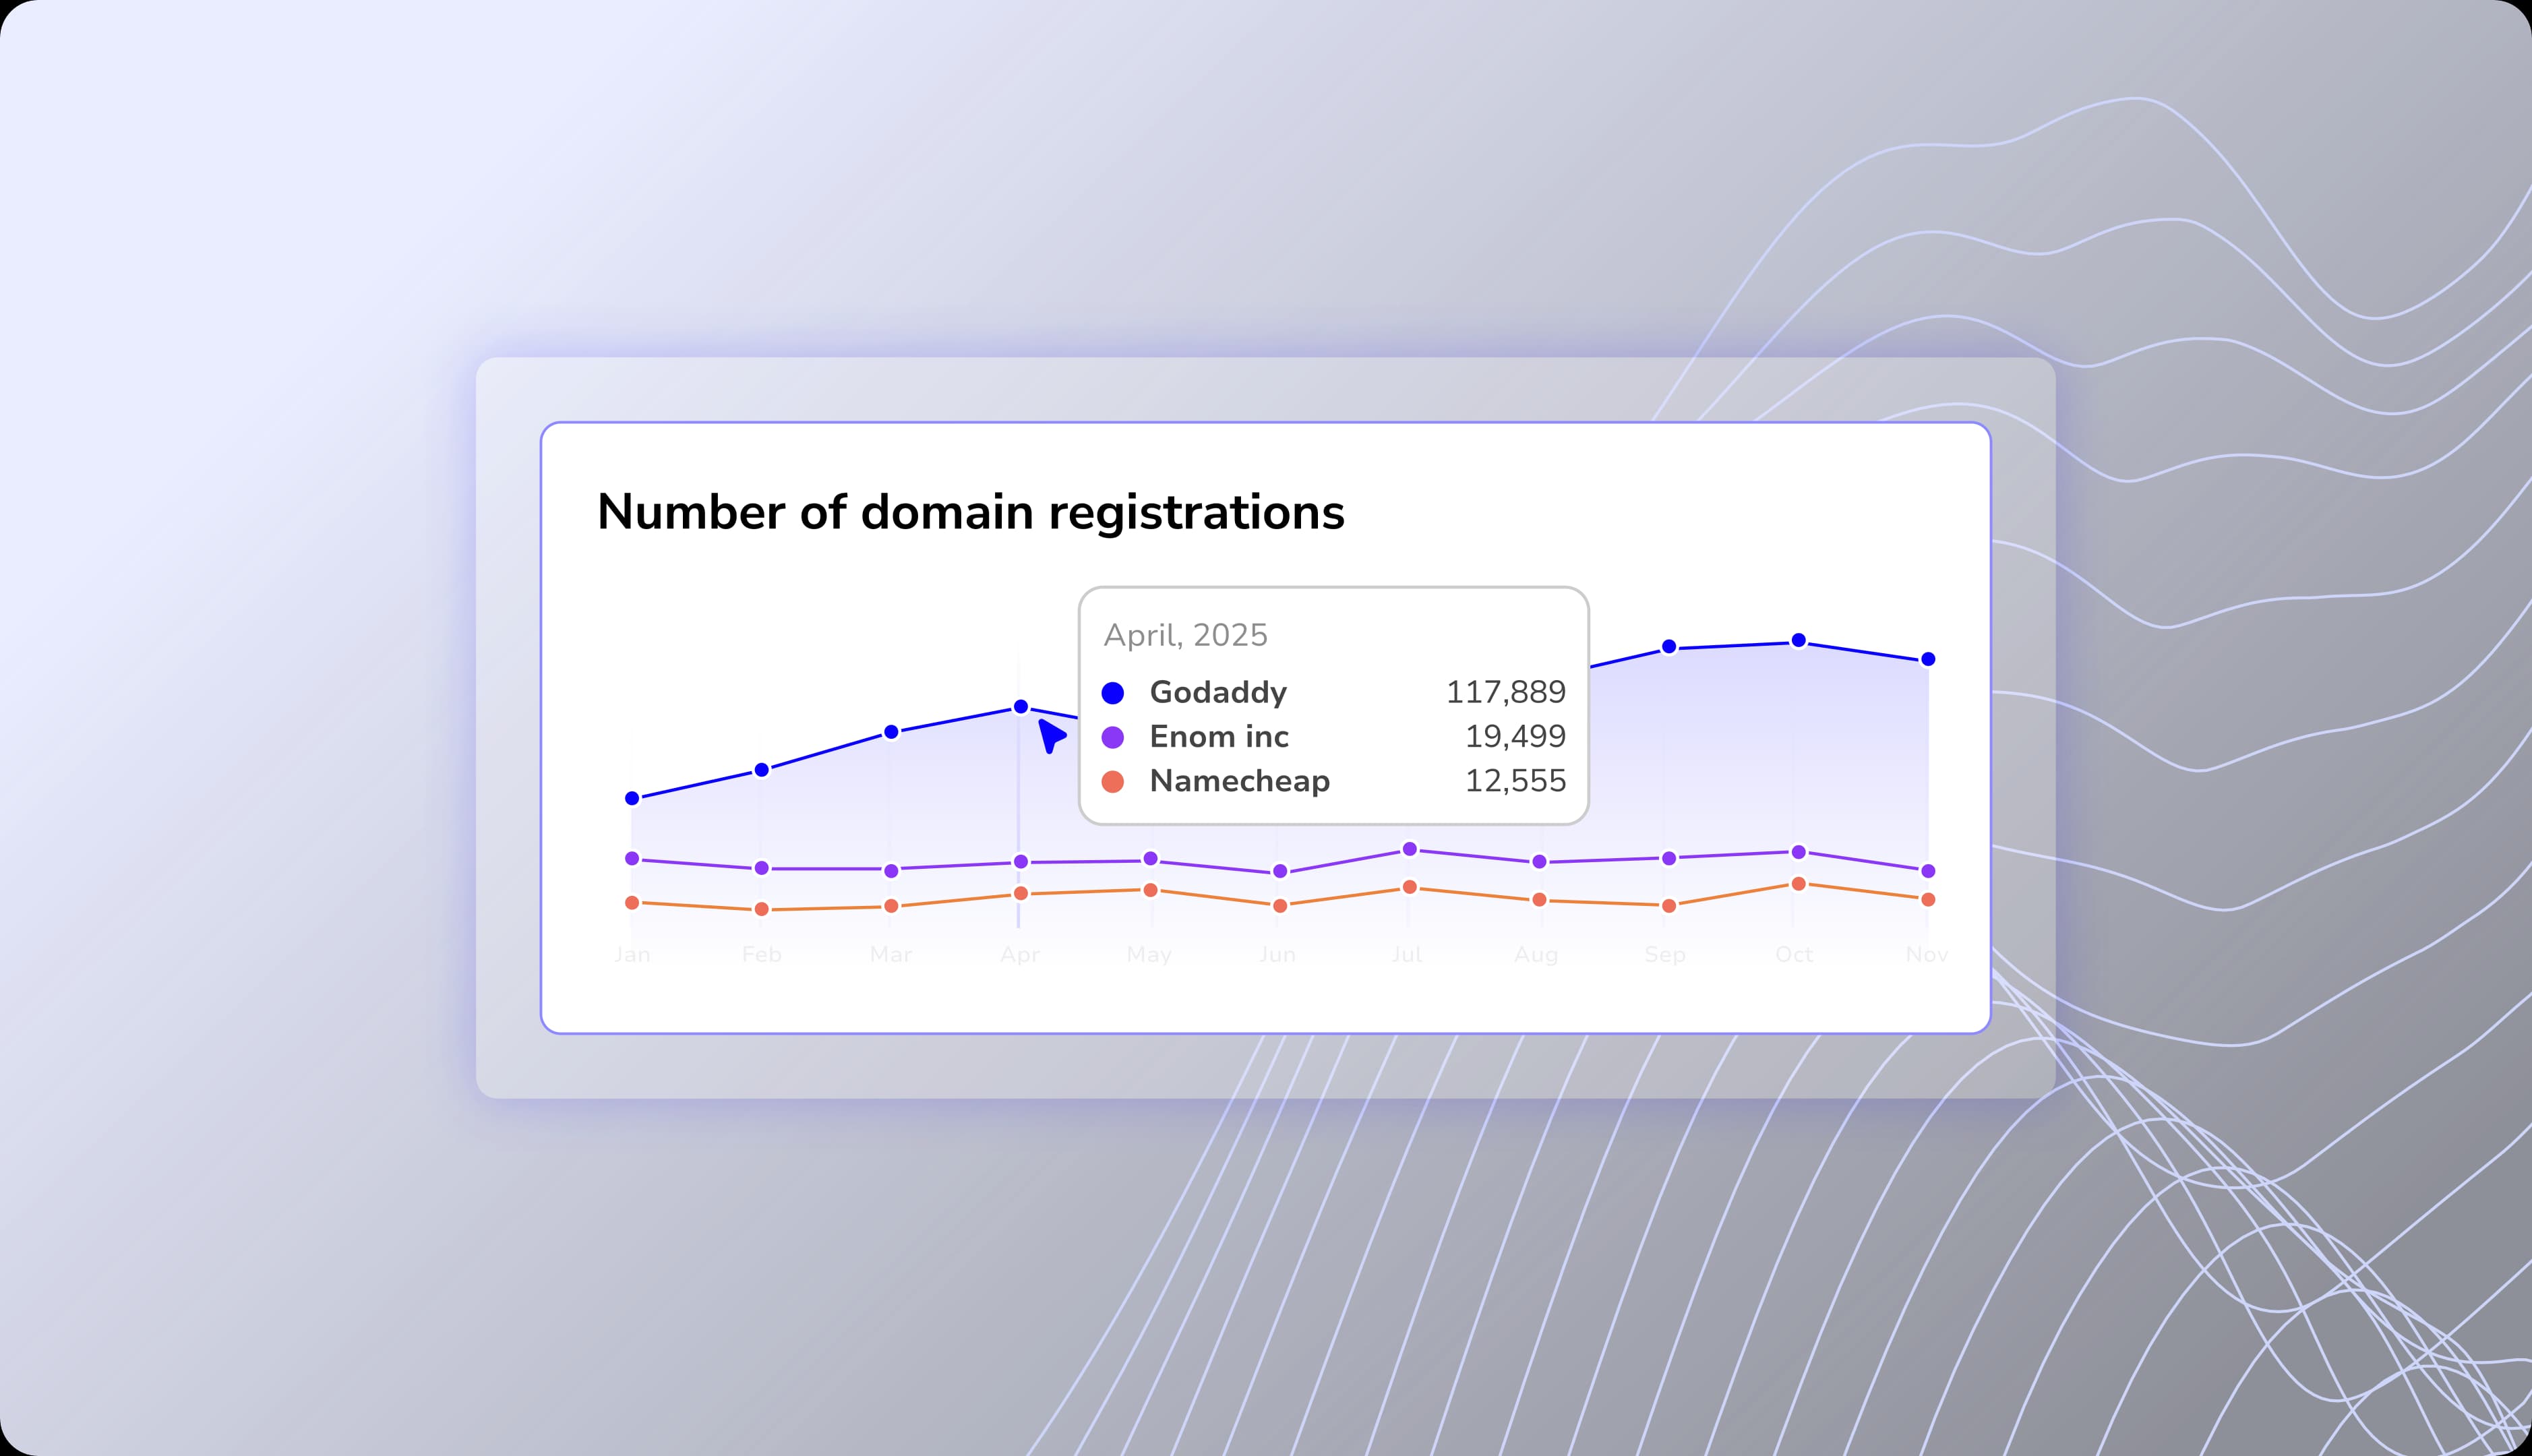
- Domain registries provide registrars with dashboards showing data on domains registered through their organization.
- Asset management firms use dashboards to track key developments of listed companies such as Shopify (NASDAQ: SHOP).
- Brands monitor dashboards that visualize where and how their trademarks are being infringed online.
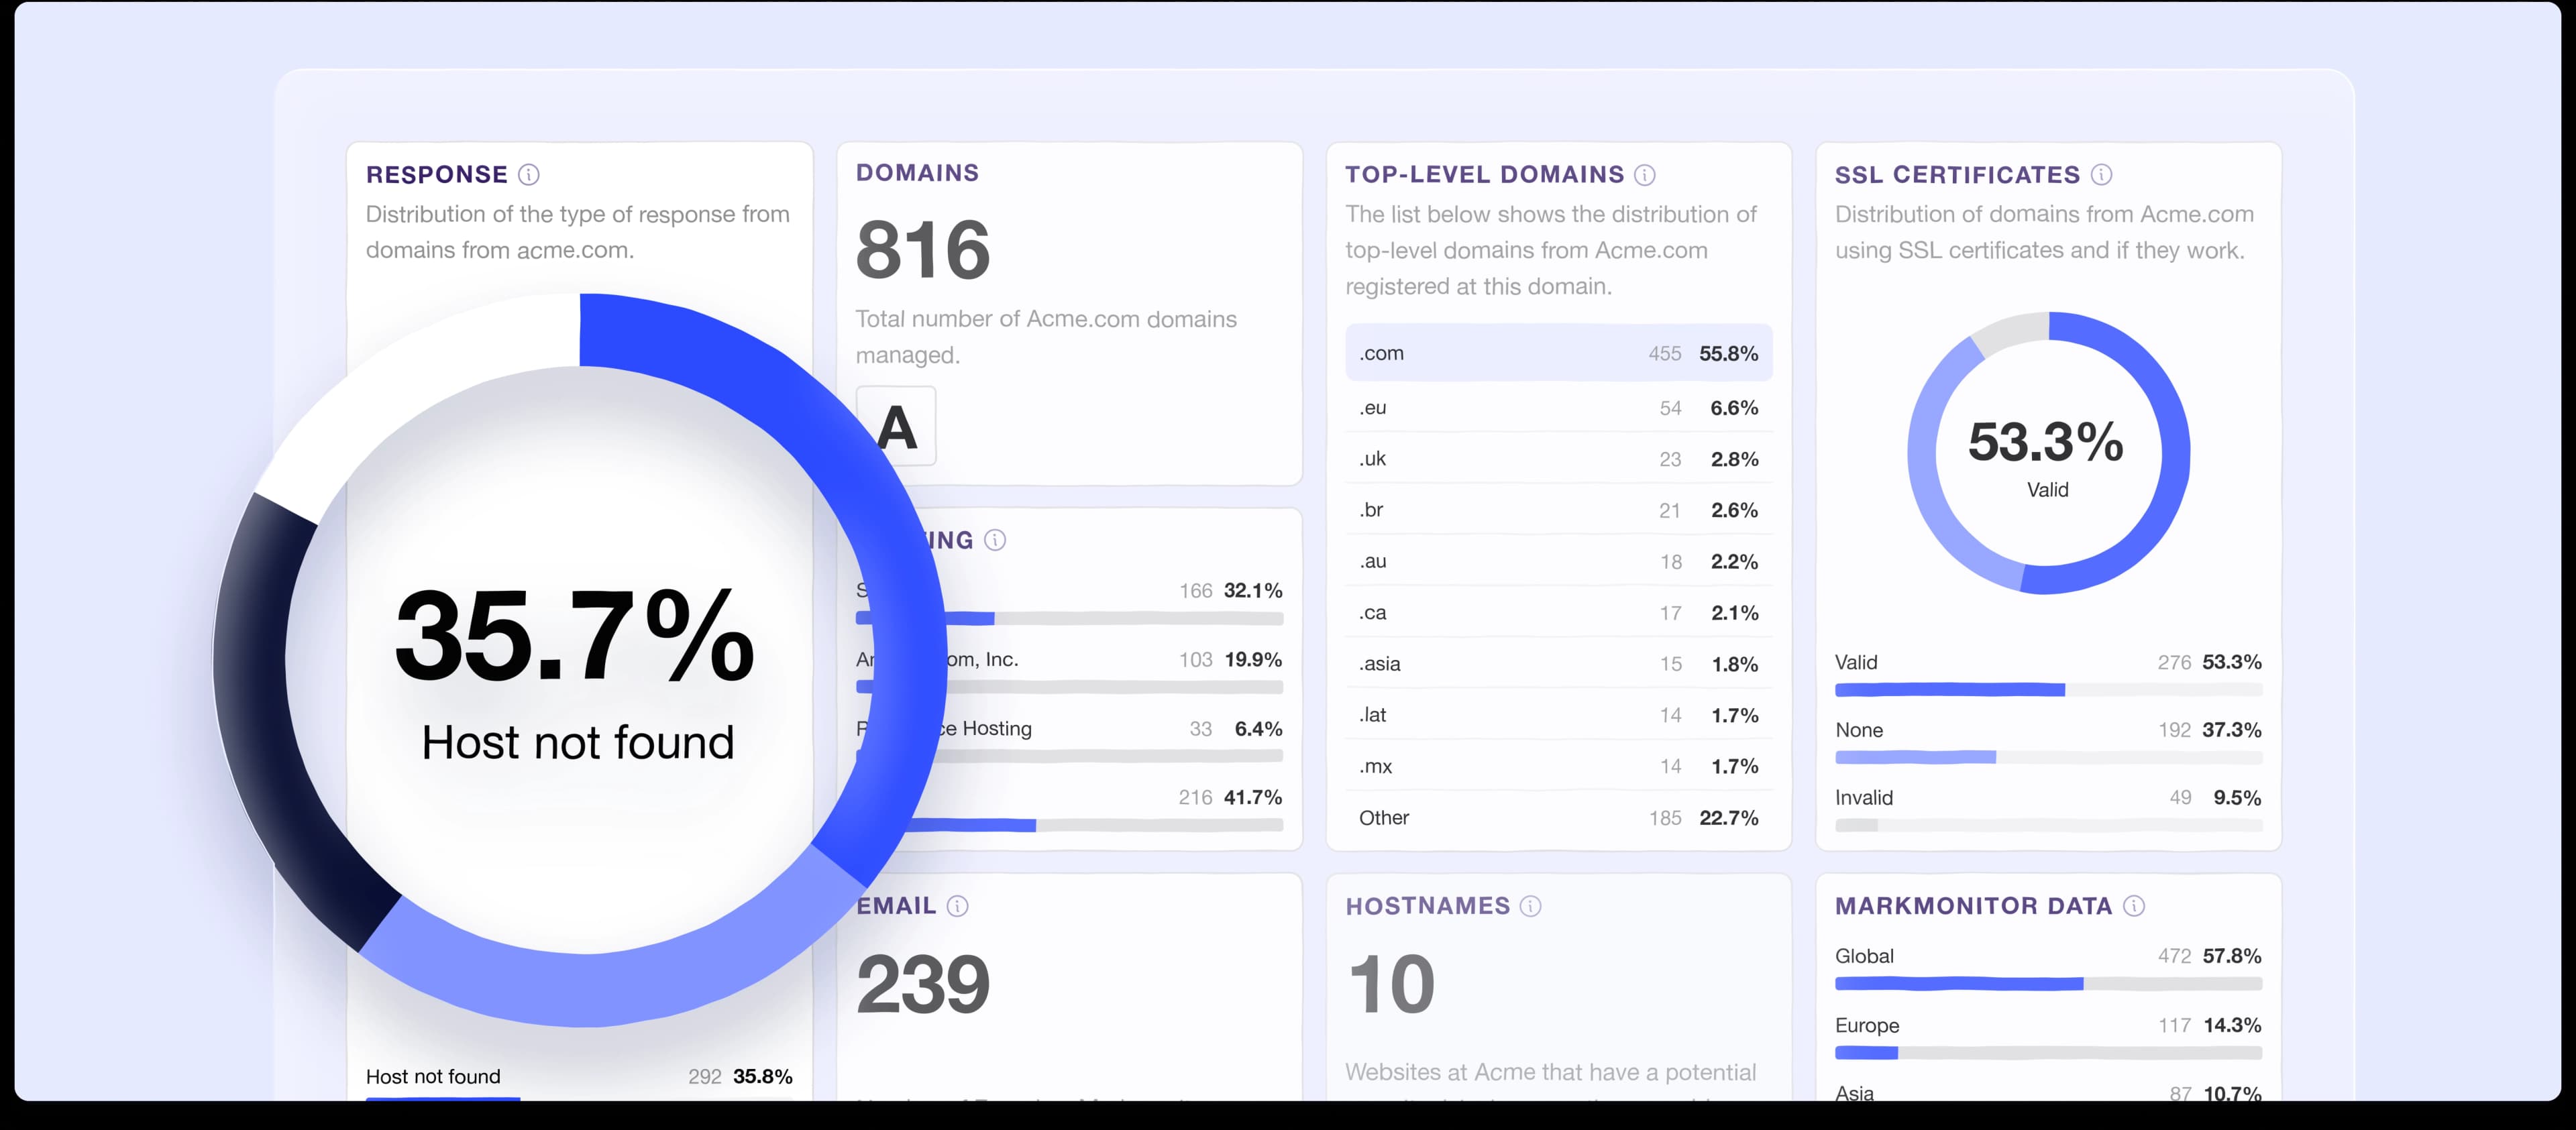
Insights at a glance
At-a-glance monitoring

Dashboards bring your most important metrics together in one view, making it easy to see trends, risks, and opportunities immediately.
Trend & market comparison
Compare industries, regions, or technologies side by side. Spot growth, decline, or shifts in adoption with structured, visual insights.
Custom views

From leadership summaries to detailed team dashboards, you can personalize the setup so everyone sees exactly what they need.
Instant sharing

Export dashboards as PDF or share them live with teams and customers. Perfect for reporting, meetings, or keeping stakeholders aligned with clear, structured visuals.
Enterprise-grade dashboards

Always up to date
Dashboards refresh monthly, so your visual insights always reflect the latest web activity.

Privacy & compliance
Hosted in Europe and fully GDPR-compliant, ensuring secure handling of sensitive data across all dashboards.

Flexible metrics
Build dashboards with any of our 200+ data fields. From technologies and business activity to e-commerce and security, you decide exactly which metrics to visualize.
Works with all data
Dashboards integrate seamlessly with both Know Your Business (private crawl) and our Search Engine (public data), giving you a unified view across all sources.