Public Sector
E-commerce: Pandemic winners and losers

In fact, in the first four months of the pandemic (Feb 2020 - May 2020), we see a 151% increase globally in the number of newly discovered e-commerce websites compared with the same period in 2019 and in line with reports from individual countries.
Two years on, we wonder how many of those e-commerce sites are still active and what distinguishes the successful ones from those that didn’t survive?
To do so, we analyze around 111,000 US e-commerce websites that were created between February and May of 2020. We then follow their monthly trajectory to see how many are still online two years later, in July 2022.
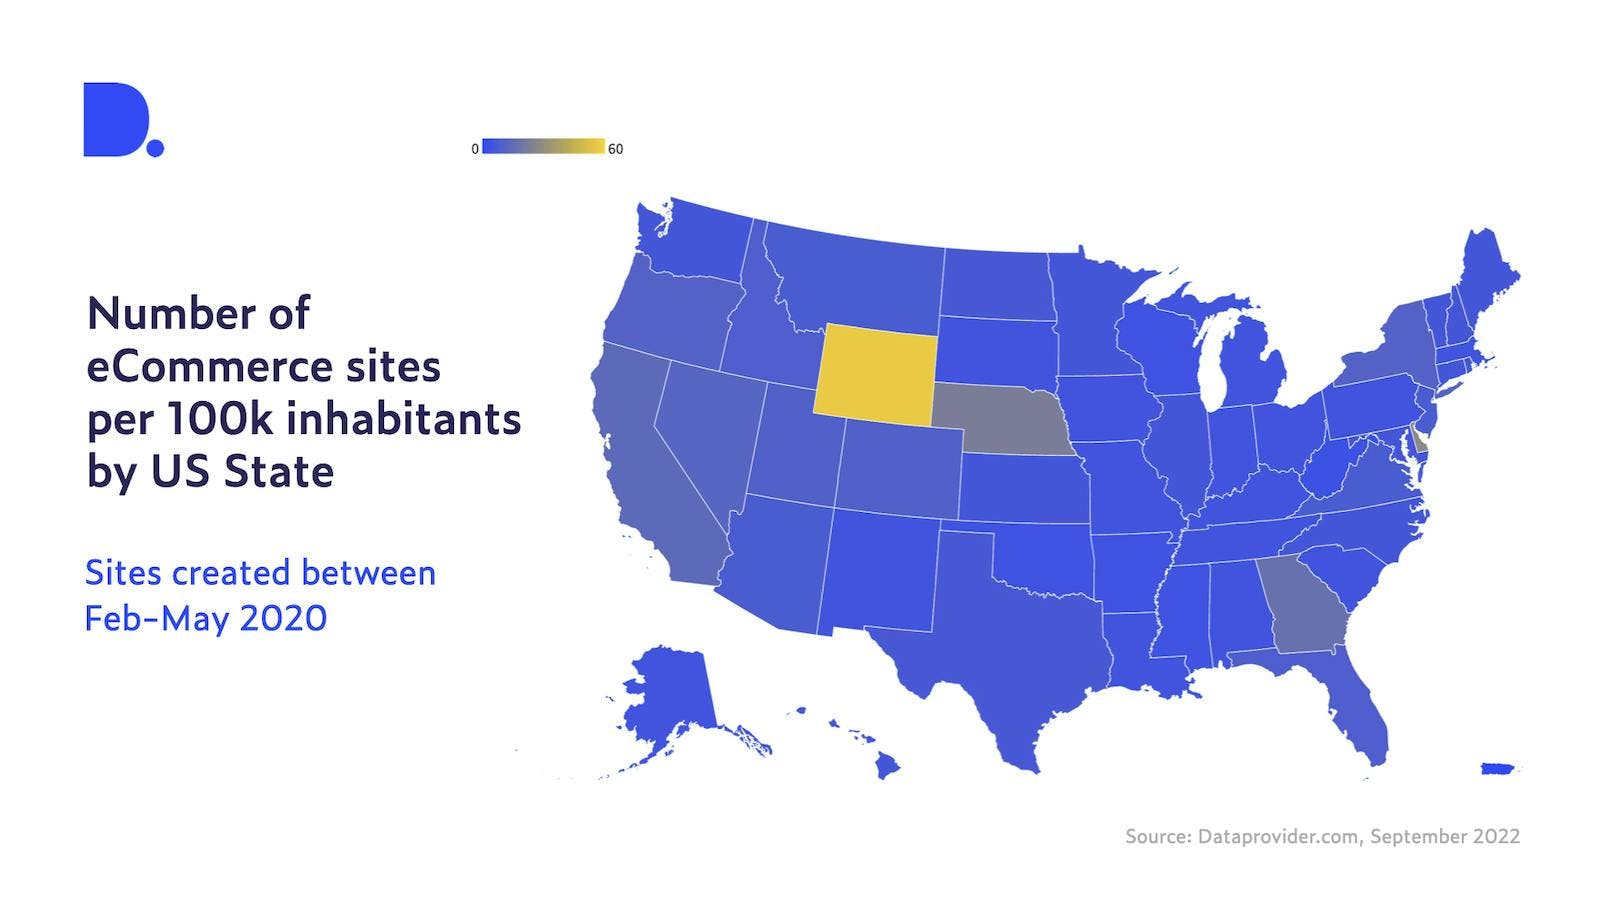
First, we have a look at the geographical distribution of those newly created e-commerce sites (based on a subsample that has identifiable state information available). Not surprisingly, California is by far the state with the largest number, followed by New York, Florida and Texas. These states are among the most populous, so to get a better idea which state has advanced their online market, we adjust numbers by population (US Census Bureau). We then see that the most online shops per 100,000 inhabitants were created in Wyoming, Delaware and Nebraska. Wyoming seems to be an outlier here as the rate is twice as high as in Delaware: 56 vs 28 e-commerce sites per 100,00 inhabitants. Half of the states fall within the range of 5.3 to 8.5 e-commerce sites for every 100,000 inhabitants.
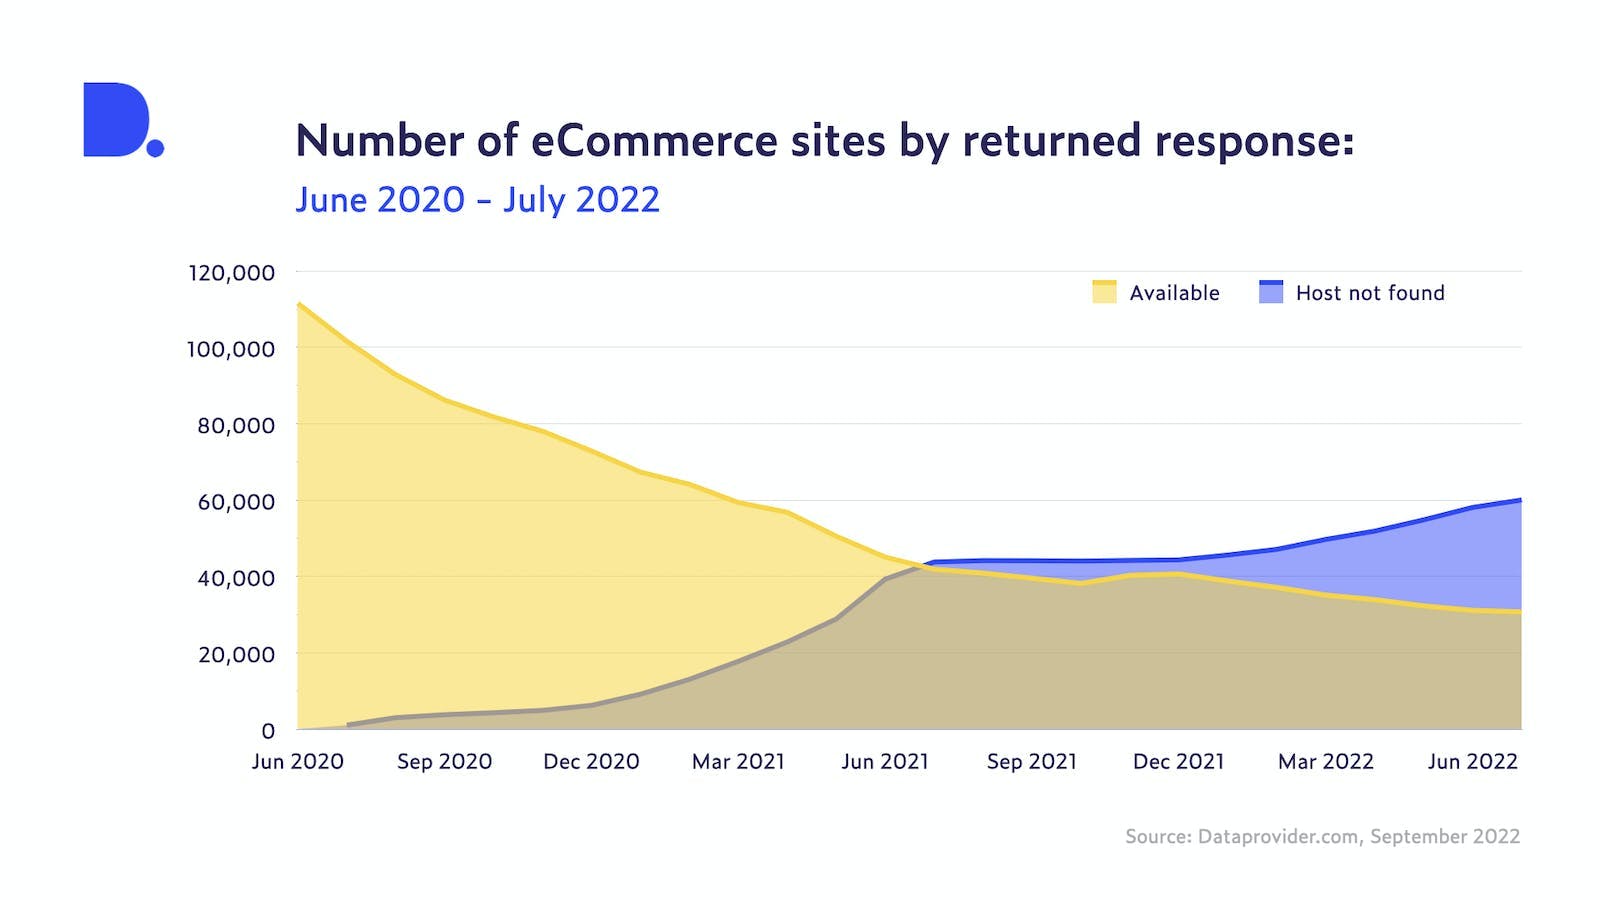
Next, we are interested in attrition over time. Figure 2 shows that as time progressed, more and more sites went offline. Specifically towards the end of the first year, many of the newly created sites disappeared. Those that made it through the first twelve months are more likely to stay online as the rate of sites going offline slowed down and then went up again towards the end of the second year.
But can we see if there are other factors that may play a role in whether an e-commerce site stays active or disappears?
To do so we look at two of our proprietary metrics: Changes and Economic Footprint. Changes refers to the number of month-on-month changes to any of the data fields we collect. Examples are changes to the word count on the website, keywords, email addresses and many more. The Economic Footprint, on the other hand, is a metric that gives an estimate of the economic impact of the website and takes into consideration information about the number of visitors, the turnover and the size of a particular business.
When we compare those e-commerce sites that are no longer active with those that are still active two years after their creation, we see that in the first few months, specifically around September 2020, those that disappeared had on average a higher Change score suggesting that these owners were more active. However, after this initial surge, the overall activity dropped off relatively quickly. In contrast, the ‘winners’ started off with less activity but maintained a relatively high activity level that would peak around December, perhaps suggesting that these businesses took advantage of the Christmas boom.
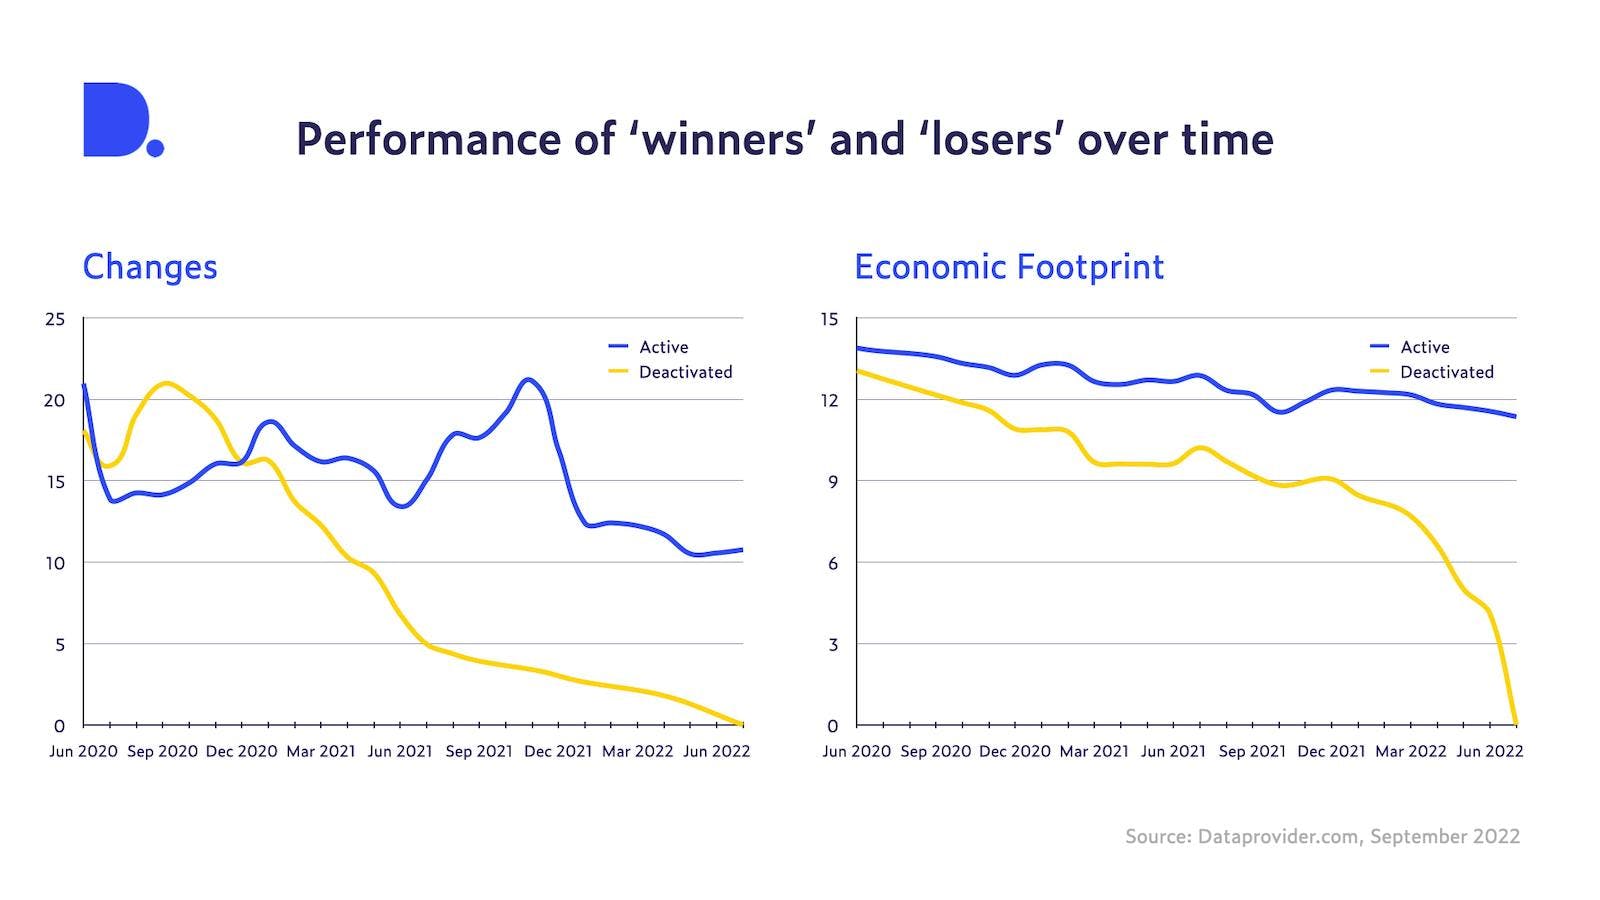
When looking at the Economic Footprint, we observe that both ‘winners’ and ‘losers’ started nearly at the same level of economic activity. However, those that are no longer active after two years lost momentum more quickly and their Footprint dropped more quickly.
What are some of the possible reasons for such a high attrition? First of all, we don’t have a benchmark (yet). It’s perfectly possible that this is the normal course of many online businesses. Data from the U.S. Bureau of Labor Statistics shows that approximately 20% of new businesses across sectors fail during the first two years of being open, 45% during the first five years and 65% during the first ten years. The rate we see here is considerably higher: 39% of e-commerce sites are no longer active after the first year while 54% have dropped off after the second year.
So, could this be due to the pandemic or is it just a phenomenon of online stores? When we take a deep dive into individual data points and look at the type of e-commerce that no longer exists, we see quite a lot of stores that were selling masks. The demand for masks has diminished rapidly after the initial shortages at the beginning of the pandemic, so it makes sense that these sites no longer exist after two years. As it’s relatively easy to set up an online business quickly, it may be uniquely suited to leverage short-lived trends.
Another reason for the high attrition likely reflects the move back to in-store businesses in many sectors. As store owners no longer need to follow mandatory closures or social distancing measures, small business owners may decide to cease any online activities they have set up during the initial stages of the pandemic.
Taken together, this analysis has shown that of the 110,000 US e-commerce sites created between February and May 2020 only around 28% are still actively operating two years later. Whether this is a unique phenomenon of the pandemic rush to go online or reflects the typical survival rate of online stores remains an open question. Regardless, overall rates of survival seem lower compared to traditional businesses perhaps due to the ease of creating an e-commerce site.